Google Ad Manager Reporting is a comprehensive tool that allows users to analyze and track the performance of their digital advertising campaigns. It provides detailed insights into metrics such as impressions, clicks, revenue, and fill rates across various dimensions like ad units, orders, and line items. With customizable reports, users can filter data to meet specific needs, enabling better decision-making and optimization of ad strategies. Additionally, the reporting interface supports scheduling and automated delivery of reports, facilitating regular performance monitoring. How can I assist you further with Google Ad Manager Reporting?
Overview of Google Ad Manager Reporting
Ad Manager reporting is a comprehensive suite of tools designed to offer insights into the performance of online advertising campaigns. Through its robust capabilities, users can access a wide range of metrics such as impressions, clicks, click-through rates, and conversions, providing a deep understanding of how ads are performing. These reports can be customized to fit the specific needs of each campaign, allowing users to generate detailed and specific views by segmenting data based on various dimensions such as time, geography, and devices. This flexibility helps in identifying trends, comparing performance across different periods, and spotting opportunities and areas for improvement.
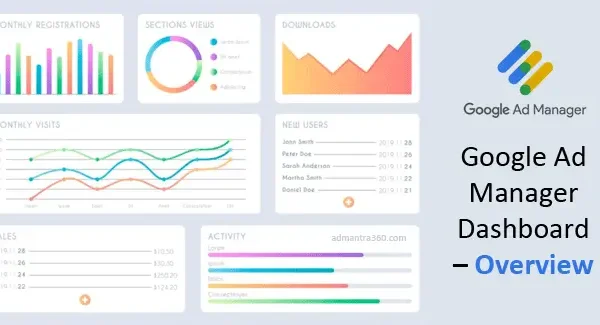
Moreover, Ad Manager’s reporting functionalities facilitate the creation of visual reports and dashboards, enabling stakeholders to easily interpret complex data sets. Advanced features, such as audience segmentation and granular targeting parameters, allow advertisers to drill down into specific sections of their customer base, understanding behaviors and preferences. Additionally, the integration with analytics tools and third-party data sources broadens the scope of insights available, ultimately aiding in more informed decision-making. This drives better optimization strategies and ensures that advertising budgets are effectively allocated to maximize return on investment.
For more details about reporting – click here
Highlights of Google Ad Manager Reports
Here’s a summary of the highlighted reports available in Google Ad Manager:
| Report Type | Description |
|---|---|
| Performance Reports | Show performance metrics like impressions, clicks, and conversions for your ads |
| Inventory Reports | Provide insights into your ad inventory, including available and sold impressions |
| Revenue Reports | Detail the revenue generated from your ad inventory, including gross and net revenue |
| Delivery Reports | Track the delivery of your ads, including fill rates and ad request sizes |
| Viewability Reports | Measure how often ads are viewable to users, including metrics like Active View and viewability rates |
| Spend Reports | Show the amount spent on different campaigns and ad placements |
| Reach Reports | Provide data on the reach of your ads, including unique users and frequency |
| Frequency Reports | Track how often users see your ads, helping to avoid overexposure |
| Creative Reports | Analyze the performance of different creatives, including click-through rates and engagement metrics |
Creating a Google Ad Manager Report: Step-by-Step
Creating a report in Google Ad Manager involves several steps, which help you track and analyze the performance of your ads. Here’s a step-by-step guide:
- Log in to Google Ad Manager: Start by logging into your Google Ad Manager account.
- Navigate to the Reports Section: Click on the “Reporting” tab in the navigation bar. This might be titled slightly differently depending on updates, but it usually involves terms like “Report” or “Analytics.”
- Create a New Report: Look for an option to create a new report, usually marked by a “New Report” button or a “+” sign.
- Choose Report Type: Select the type of report you want to create. Common types include “Historical,” “Forecast,” “Lifetime Value,” etc. Choose one that suits your needs.
- Set Date Range: Select the time period for your report. This could range from specific days to months or custom date ranges.
- Select Metrics and Dimensions: Choose the metrics (e.g., clicks, impressions, revenue) and dimensions (e.g., ad unit, line item, advertiser) that you want to include in your report. This step is crucial for customizing the insights you wish to gather.
- Apply Filters: Use filters to narrow down data to specific campaigns, ad units, devices, etc. This helps in focusing on particular segments of your ad inventory.
- Preview the Report: It’s helpful to preview the report to ensure it includes the information and format that you need.
- Run the Report: Once everything is set, run the report. Depending on the amount of data, this might take some time.
- Download or Export the Report: After the report is generated, you can download it in various formats, such as CSV, Excel, or PDF, for further analysis or sharing with stakeholders.
- Schedule Future Reports(Optional): If you need this report regularly, you can schedule it to run automatically at set intervals.
Customizing Reports in Google Ad Manager
To get customized insights using Google Ad Manager reporting, you’ll need to set up and generate custom reports effectively. Here’s a basic guide to get you started:
- Define Your Goals: What specific insights are you looking for? Are you interested in specific metrics like ad impressions, clicks, revenue, or audience data? Knowing your goals will help you choose the right metrics and dimensions for your report.
- Access Google Ad Manager: Log in to your Google Ad Manager account to access the reporting features.
- Create a New Report:
- Navigate to the “Reports” section.
- Click on “New report” to start setting up your custom report.
- Select Report Type: Choose between different types of reports such as “Ad performance”, “Line item”, “Historical”, or other types based on your goals.
- Choose Metrics and Dimensions:
- Metrics: Choose what you want to measure (e.g., impressions, clicks, CTR, eCPM).
- Dimensions: Select how you want to break down these metrics (e.g., by date, ad unit, device, geography).
- Set Date Range and Filters: Specify the time period for your report and add any necessary filters to narrow down the data, such as specific ad units or geographic locations.
- Run the Report: Once all parameters are set, run the report to generate your insights.
- Analyze the Data: Use the report to derive insights and inform decisions. Look for trends, high-performing segments, or areas to improve.
Integrating Google Ad Manager with Reporting Tools
Integrating Google Ad Manager with reporting tools can offer extensive insights into your ad performance. Here’s a general approach on how you can achieve this:
- Choose the Right Reporting Tool: Determine which reporting tool you want to use. Popular choices include Google Data Studio, Tableau, Power BI, and others. Each has its own methods and connectors for integration.
- Use Google Ad Manager APIs: If you want to fetch data programmatically, you’ll need to utilize the Google Ad Manager APIs. The API allows you to query your ad data and can be integrated with most reporting platforms via either direct APIs or by exporting data to a format like CSV.
- Direct Integration or Connectors: Some reporting tools (such as Google Data Studio) may offer direct integration options or connectors specifically for Google Ad Manager. Check if the tool you use supports this, as it can simplify the integration process.
- Data Export and Import: As an alternative, you can set up automated data exports from Google Ad Manager in a common format such as CSV or Excel, and then import these files into your chosen reporting tool. This method can be suited for regular reporting cycles.
- Use Third-Party Solutions: Look into third-party integration solutions that can bridge Google Ad Manager data with your reporting tools. These might offer more robust features or simplify the data handling process.
Creating a Google Ad Manager Report Template
Creating a Google Ad Manager report template involves organizing your report to effectively capture the metrics and dimensions most important to your campaigns. First, identify the primary objectives of your campaign, such as increasing impressions, clicks, or conversions. Then, select metrics that align with these goals, like impression counts, click-through rates (CTR), and conversion rates. You might also want to include dimensions like date ranges, devices, geographical locations, and ad units to provide context to your data. Make sure your template provides a comprehensive overview while remaining easily understandable.
Next, structure your report by grouping related metrics and dimensions, which can help in drawing meaningful insights. Consider using a dashboard format for a visual summary, highlighting key performance indicators (KPIs) at the top of the report for quick insights. Charts and graphs can be incorporated to visually represent trends over time, making it easier to communicate changes and results to stakeholders. This layout will ensure that your report is not only informative but also engaging, allowing quick access to pertinent data points.
Finally, streamline the reporting process by leveraging automation where possible. Google Ad Manager offers features like saved queries and scheduled email reports, which can reduce manual effort and improve consistency in your reporting. Ensure your template is flexible enough to adapt to changes in campaign objectives or reporting requirements. It’s beneficial to periodically review and update your report template to incorporate new metrics or dimensions that could offer additional insights, ensuring the report remains aligned with the latest goals and strategies.
Integrating Google Ad Manager Reporting API
To use the Google Ad Manager Reporting API, you’ll generally need to follow these steps:
- Obtain API Credentials: Ensure you have access to the Google Ad Manager account and obtain the necessary API credentials from the Google Cloud Console.
- Install Client Libraries: Google provides client libraries in various languages like Python, Java, and PHP. Install the library in your preferred language.
- Authenticate: Use the OAuth 2.0 protocol to authenticate your API requests. You will need the credentials you obtained earlier.
- Set Up API Service: Initialize the Ad Manager service using the client library.
- Create a Report Query: Define the dimensions, metrics, and date range for your report. This query will determine what data you retrieve.
- Fetch and Process the Report: Execute the report query and retrieve the data. You may need to handle large reports in multiple parts or pages.
- Handle the Response: Parse and process the report data as needed for your application or analysis.
FAQs
When it comes to Google Ad Manager Reporting, there are a variety of frequently asked questions that people might have. Here are a few common ones:
Reports can be created by navigating to the “Reports” section, where you can select from a variety of report templates or build a custom report using dimensions and metrics suited to your needs.
Dimensions are attributes of your data, such as ad unit, date, or advertiser. Metrics are quantitative measurements, like clicks, impressions, or revenue.
When saving your report, you can opt to schedule it by setting up the frequency, time, and recipients for the automatic email delivery of the report.
Yes, reports can be exported in various formats such as CSV, Excel, or PDF for further analysis and sharing.
Filters can be applied while setting up your report or editing it later, allowing you to narrow the data shown based on specific criteria like date range, advertiser, or ad unit.
First, verify the dimensions and metrics used are correct. Consider checking if there are any filters applied or if there’s been any delay in data sync. If issues persist, consulting Google Ad Manager support may be necessary.
You can use the “Compare to” feature when setting the date range, allowing you to see performance differences between two specified periods.


